

By Emily Puntenney and Gerry Smedinghoff
Medicare Advantage with Part D (MA-PD), Affordable Care Act (ACA) markets, and some state Medicaid managed care programs include a risk adjustment (RA) component. Each program employs RA to ensure issuers are adequately compensated for the population they cover while increasing opportunities to obtain health insurance coverage. However, these markets operate within different structures, and there are significant differences in the RA models, calculations, and funding sources.
While the risk adjustment system and its mechanisms are of course not a game, the following metaphor aims to provide some colorful context for audiences not otherwise familiar with them.
Medicare risk adjustment can be considered analogous to a blackjack table in a casino, where the astute player who counts cards can obtain a slight advantage over the house (the federal government), which must lay its cards out on the table, and has its moves limited by defined rules. Because carriers already have almost all of the information, they can fairly easily estimate the final score in advance.
Medicaid risk adjustment, on the other hand, is analogous to a poker tournament, where the house (the state government) wants the player to remain in the casino. In this case, the house will extend a gambling marker to the player to support inadequate winnings under a few conditions. These include circumstances where faulty information for the carriers lead to losses or provisions for the house to share in winnings.
ACA risk adjustment is also similar to a poker tournament, but the house has no stake in the outcome. So, by definition, any advantage obtained by one player is translated into a disadvantage of another. In other words, it resembles a zero-sum game on the frontier of the Wild West. Not only are there multiple counterparties to compete against and consider, but in a zero-sum game, there is no defined method to obtain an advantage. For every winner, there is a corresponding loser because the size of the pie is fixed.
To further complicate matters, in the ACA risk adjustment process, the competing carriers that comprise the counterparties do not show their cards. This means that as carriers proceed through each round of play (i.e., a plan year), they do not know what their competitors are doing, and thus do not know where they stand relative to one another. They only find out whether they won or lost—and by how much—several months later after the game is over when the Centers for Medicare and Medicaid Services (CMS) posts the final risk scores.
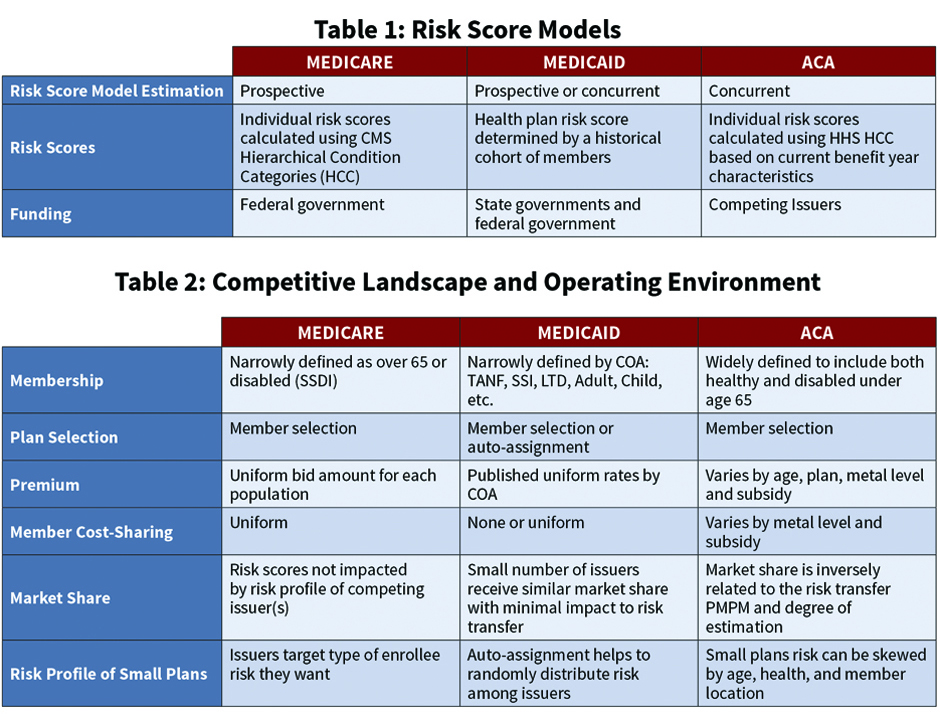
Clearly, the variations in the risk adjustment programs require different models, methods, and calculations by both the carrier and the program sponsor. Table 1 illustrates the different risk score models used by CMS and state governments to calculate the risk transfer amounts.
To further illustrate the variation in the programs, Table 2 shows several categories of the competitive landscape and operating environment of the Medicare, Medicaid, and ACA risk adjusted products. Each of these categories impact potential risk and assumptions necessary to accurately estimate the RA accrual. For example, the definitions of the Categories Of Aid (COA) of the enrolling populations in the Medicare and Medicaid programs are much narrower than in the individual ACA marketplace. Of course, narrowing the definitions reduces the variance, which reduces the potential risk before any risk adjustment is even applied. Similarly, the definition of the enrolling population influences claim data expectations and actuarial assumptions required to forecast the plan’s overall risk profile.
MA-PD Risk Adjustment
The Medicare risk adjustment process lies at the easiest and safest end of health care risk adjustment because the population health risk is not shared among the participating MA-PD plans—rather it is split between each issuer and the federal government. That is to say, an MA-PD plan that increases its average risk score by 5% from 1.00 to 1.05 will also increase its premium revenue by 5%, with this premium increase funded by the federal government. So in Medicare risk adjustment, the federal government has the counterparty risk, and the federal government stands to gain financially if the issuers enroll lower levels of Medicare risk. It must increase its premium payments to the issuers if the enrolling MA-PD members have higher-than-projected risk scores.
In Medicare, issuers can target specific special-needs populations with chronic conditions, and be proportionally compensated for the increased level of enrollee risk. In addition to the predefined uniformity of the enrolling members into Medicare special-needs plans is the predefined uniformity of Medicare member cost-sharing. The uniformity of the enrolling members limits the variance of the morbidity risk, and the uniformity of the cost-sharing limits the variance of member behavior in response to incentives. This helps reduce adverse plan selection.
As described above, premium revenue is based on the enrolled population’s overall risk. The risk scores calculated in a specific year are used to determine an MA-PD plan’s premium revenue the following year. For example, a member’s risk score calculated from 2018 incurred claim data is used to determine the health plan’s premium during the 2019 benefit year. The final risk scores are calculated from claims data submitted up to 13 months after the close of the benefit year. Consequently, the final MA-PD risk scores for benefit year 2019 will be calculated from benefit year 2018 incurred claim data with runout through Jan. 31, 2020.
We noted carriers already have almost all of the information, and they can fairly easily estimate the final risk score in advance. Consequently, the need for actuarial estimates is reduced in comparison to Medicaid and ACA RA calculations. To accurately estimate the MA-PD risk adjustment accrual, the actuary should consider not only claim runout, but also the impact of operational initiatives impacting the quality of claim data. For example, many companies perform medical chart reviews to ensure claim submissions are accurate, and others incentivize providers to maintain and submit comprehensive claims through gain-sharing agreements.
Medicaid Risk Adjustment
State Medicaid managed care programs typically limit the number of qualifying issuers, with some states only offering two or three. This limited scope of offerings is generally sufficient to ensure that each participating issuer gets a significant percentage of the eligible population. Credible and sufficient enrollment for participating issuers is further assured by the auto-assignment algorithm that randomly enrolls members (who fail to initially select a plan) among the eligible Medicaid issuers. Neither of these risk mitigation safeguards exist in the Medicare Advantage market and the state ACA exchanges, which can be described as the extremes of the risk adjustment spectrum, with Medicaid somewhere in-between.
In state Medicaid managed care programs, the COAs—and thus groupings for risk adjustment—are defined as healthy (TANF) and disabled (SSI and LTD), sometimes with these groups further subdivided into relative age brackets, with each COA having a uniform premium rate. Consistent with Medicare, Medicaid predefines uniform member cost-sharing. As described above, this uniformity limits the carrier’s variation in risk.
ACA Risk Adjustment
The pool of potential ACA enrollees is broadly defined, and issuers in the market may have significant variances in risk relative to competitors. The RA accrual requires insurance companies to calculate plan risk score relative to competitors and statewide risk score, which is not publicly available. Further, the RA accrual is calculated using the current benefit year risk scores based on a predefined formula incorporating each enrollee’s demographic, enrollment, premium subsidy, and claims information. This information is gathered throughout the year, and estimates are required to calculate the plan’s own expected benefit year results in advance of having its own complete data. With such a large gap in available information, estimating the ultimate outcomes of the ACA risk adjustment process becomes as much of an art as a science.
The information void with respect to competitors can be significantly reduced by gaining access to statewide risk scores made available by a state Department of Insurance (DOI) or third-party data aggregator. The information void is also reduced as internal risk scores become known throughout the year, and this additional information is amplified as the carrier’s market share increases.
Because the determination of the final scores is a relative (rather than absolute) calculation, many more unknown and undetermined variables help confound the accrual estimation process. However, issuers have advanced the art of ACA risk adjustment accrual estimation by augmenting their models over time. After six years of estimating ACA RA accruals, several common practices have emerged throughout the industry.
Models typically separately evaluate each individual and small group market by state. Where credible data are available, additional granularity in the model may include projections by metallic tier of gold, silver, and bronze plans that establish premium level and cost-sharing for members.
- The actuary evaluates historical accrual estimates compared to final risk transfer amounts to assess model assumptions.
- Issuers internally calculate and monitor risk scores through the year for emerging patterns that diverge from historical patterns.
- Issuers leverage internal and external information to estimate trends. For example, historical risk scores of renewed enrollees might be used to more accurately estimate current-year risk scores.
- Issuers monitor their market share and assess the impact of external forces such as competitor entrants and exits within a market, regulatory and environmental changes, and market disruptions.
- Adjustments are typically made to account for internal activities such as chart reviews, care management, or claim analysis to improve risk scores.
The ACA program enrolls the widest range of member risk, while providing the least amount of relevant information. As with any art form, the definition, manipulation, and modeling of these factors and adjustments is a trial-and-error process. Some work well, while others don’t. Some work fairly well … some of the time. And all need to be continually refined to adjust for the relative nature of the moving targets they are trying to measure. However, the risk of failing to consider these nuanced factors is even greater than misestimating them, because stagnant carriers that ignore the evolving complexity of the health care market are likely to permanently fall behind their competitors.
EMILY PUNTENNEY, MAAA, ASA, and GERRY SMEDINGHOFF, MAAA, ASA, ACA are consulting actuaries at KPMG.