
Editor’s note: Some readers may recall that Contingencies ran a feature with this same headline back in September/October 2015. This piece is a follow-up, based on new a new report from the American Society of Civil Engineers (ASCE).
Increased investment leads to signs of progress … but more work remains to be done
By Anna Denecke
Illustration by Val Bokchov
Our nation is at a crossroads. Deteriorating U.S. infrastructure is impeding our ability to compete in the global economy, and improvements are necessary to ensure our country is built for the future. While we have made some progress, reversing the trajectory after a generation of underinvestment in our infrastructure requires transformative action from Congress, states, infrastructure owners, and the American people.
To capture macro trends and synthesize progress, or lack thereof, for elected officials and the public, every four years the American Society of Civil Engineers (ASCE) provide a comprehensive assessment of the nation’s 17 major infrastructure categories in ASCE’s Infrastructure Report Card. Using a simple A–to-F school report card format, the report card examines current infrastructure conditions and needs, assigning grades and making recommendations to raise them.
The 2021 Report Card for America’s Infrastructure, released March 3, reveals we’ve made some incremental progress toward restoring our nation’s infrastructure. For the first time in 20 years, our infrastructure is out of the D range—our cumulative GPA comes in at a C–.
Five category grades—aviation, drinking water, energy, inland waterways, and ports—went up, while just one category—bridges—went down. And stormwater infrastructure received its first grade: a disappointing D. Overall, however, 11 category grades were stuck in the D range, a clear signal that our overdue bill on infrastructure is a long way from being paid off.
Key takeaways from the latest set of ASCE grades include the finding that maintenance backlogs continue to be an issue, especially in the legacy transit and water systems. However, asset management is increasingly helping to prioritize limited funding. Specifically, developing a clear picture of where the available funding is most needed improves overall system performance and public safety.
Additionally, state and local governments have made some progress. Federal investment, when available, has also positively impacted certain categories. Thirty-seven states have raised their gas tax to fund critical transportation investments since 2010. Ninety-eight percent of local infrastructure ballot initiatives passed in November 2020. At least 25 major cities and states now have chief resilience officers. These improvements were made by elected officials from both sides of the aisle and with strong voter support. Meanwhile, categories like ports, drinking water, and inland waterways have been the beneficiaries of increased federal funding.
The 2021 Report Card for America’s Infrastructure found that there are still infrastructure sectors where data is scarce or unreliable. Infrastructure assets like school facilities, levees, and stormwater suffer from a lack of robust condition information or even an inventory of assets. School facilities represent the second-largest sector of public infrastructure spending, after highways, and yet there is no comprehensive national data source on K–12 public school infrastructure. To target investments and allocate funding, routine, reliable data should be collected and aggregated.
The elected officials and members of the public who have improved infrastructure policy and supported additional funding are applauded. We’re seeing the benefits of this action in drinking water, inland waterways, and airports. The private sector has invested in the electric grid, freight rail, and more.
However, significant challenges lie ahead. Importantly, the COVID-19 pandemic’s impacts on infrastructure revenue streams threaten to derail the modest progress we’ve made over the past four years. In addition, many sectors and infrastructure owners are learning what it will take to make our communities climate-resilient as we grapple with more severe weather. Meanwhile, many of our legacy transportation and water resource systems are still in the D range. These infrastructure networks suffer from chronic underinvestment and are in poor condition.
Big and bold action from Washington, as well as continued prioritization by states and localities, is needed to bring all our infrastructure to a state of good repair. This ASCE report card is good news and an indication we’re headed in the right direction, but a lot of work remains.
Transportation
Our transportation systems represent some of the most recognizable infrastructure. Our roads, bridges, transit, and aviation systems are critical to ensuring we get to work, reach the hospital, and take vacations. Unfortunately, the transportation system also includes some of the lowest category grades in the 2021 Report Card for America’s Infrastructure.
America’s roads are frequently underfunded, and over 40% of the system is now in poor or mediocre condition. This partially contributed to the low grade of a D in the report card released on March 3, the same score the category earned in 2017. As the backlog of roadway rehabilitation needs grows, motorists are forced to pay over $1,000 every year in wasted time and fuel. Additionally, while traffic fatalities have been on the decline, over 36,000 people are still dying on the nation’s roads every year, and the number of pedestrian fatalities is on the rise.
Federal, state, and local governments will need to prioritize strategic investments dedicated to improving and preserving roadway conditions that increase public safety on the system we have in place—as well as plan for the roadways of the future, which will need to account for connected and autonomous vehicles.
The transit grade of a D– was the lowest category grade in the 2021 Report Card for America’s Infrastructure. Public transit is essential to everyday living in communities across the country, providing access to jobs, schools, shopping, health care, and other services while enabling equitable access and sustainable mobility options. Unfortunately, 45% of Americans have no access to transit. Meanwhile, much of the existing system is aging, and transit agencies often lack sufficient funds to keep their existing systems in good working order. Over a 10-year period across the country, 19% of transit vehicles, and 6% of fixed guideway elements like tracks and tunnels were rated in “poor” condition.
Currently, there is a $176 billion transit backlog, a deficit that is expected to grow to more than $270 billion through 2029. Meanwhile, transit ridership is declining, a trend compounded by the COVID-19 pandemic. Failure to meaningfully invest in transit service will only exacerbate ridership declines as service cuts mean that trip delays and reliability issues become more frequent. This stands to increase congestion, hamper the economy, and worsen air quality in the coming years.

Bridges earned a C, down from a C+ in 2017. There are more than 617,000 bridges across the United States. Currently, 42% of all such structures are at least 50 years old, and 46,154, or 7.5% of the nation’s bridges, are considered structurally deficient, meaning they are in “poor” condition. Unfortunately, 178 million trips are taken across these structurally deficient bridges every day. In recent years, though the number of structurally deficient bridges has continued to decline, the rate of improvements has slowed.
A recent estimate for the nation’s backlog of bridge repair needs is $125 billion. We need to increase spending on bridge rehabilitation from $14.4 billion annually to $22.7 billion annually, or by 58%, if we are to improve the condition. At the current rate of investment, it will take until 2071 to make all of the repairs that are currently necessary, and the additional deterioration over the next 50 years will become overwhelming.
Finally, aviation earned a D+, a slight uptick from the D the system earned in 2017. Prior to the onset of the COVID-19 pandemic, the nation’s airports were facing growing capacity challenges. Over a two-year period, passenger travel steadily increased from 964.7 million to 1.2 billion per year, yet flight service only increased from 9.7 million to 10.2 million flights per year—contributing in part to a total of nearly 96 million delay minutes for airline passengers in 2019. Terminal, gate, and ramp availability were not meeting the needs of a growing passenger base.
Under pre-COVID-19 projections, our aviation system was set to have a 10-year, $111 billion funding shortfall, and that gap has likely grown significantly as passenger volumes dropped in March 2020 and have yet to recover. However, funding from Congress has risen from $11 billion annually to approximately $15 billion from 2017 to 2020. These additional investments are driving some early results as measured by improved economic performance.
Water
Our water systems—from the tap to the toilet—support public health and quality of life. Our nation’s drinking water infrastructure system is made up of 2.2 million miles of underground pipes that deliver safe, reliable water to millions of people. In general, the system is aging and underfunded. There is a water main break every two minutes and an estimated 6 billion gallons of treated water lost each day in the U.S.—enough to fill over 9,000 swimming pools.
However, there are signs of progress as federal financing programs expand and water utilities raise rates to reinvest in their networks. It is estimated that more than 12,000 miles of water pipes were planned to be replaced by drinking water utilities across the country in the year 2020 alone. In 2019, about a third of all utilities had a robust asset management program in place to help prioritize their capital and operations/maintenance investments, which is an increase from 20% in 2016. Reflecting these trends, the drinking water infrastructure grade jumped from a D in 2017 to a C– in 2021.
Wastewater, on the other hand, stayed at a D+ in the 2021 Report Card for America’s Infrastructure. The nation’s more than 16,000 wastewater treatment plants are functioning, on average, at 81% of their design capacities, while 15% have reached or exceeded it. Growing urban environments signal a trend that these facilities will increasingly accommodate a larger portion of the nation’s wastewater demand. Though large-scale capital improvements have been made to systems experiencing sanitary sewer overflows, efforts have slowed in recent years.
As many treatment plants and collection networks approach the end of their lifespans, the financial responsibilities for operation and maintenance will become more costly. Estimates indicate that utilities spent over $3 billion in 2019, or more than $18 per wastewater customer, to replace the almost 4,700 miles of pipeline nationwide. Recently, the more prevalent use of asset management plans enables 62% of surveyed utilities to proactively manage wastewater infrastructure maintenance rather than reactively respond to pipeline and equipment failures.
In its debut in the report card, stormwater infrastructure earned a disappointing D grade. Stormwater systems range from large concrete storm sewers, roadside ditches, and flood control reservoirs to rain gardens and natural riverine systems. While stormwater utilities are on the rise, with more than 40 states having at least one, the impervious surfaces in cities and suburbs are also expanding, exacerbating urban flooding, which results in $9 billion in damages annually.
Stormwater also affects water quality as polluted runoff from pavement enters water bodies. Nearly 600,000 miles of rivers and streams and more than 13 million acres of lakes, reservoirs, and ponds are considered impaired. Federal funding, though up in recent years, averages about $250 million annually, which leaves a growing annual funding gap of $8 billion just to comply with current regulations. With few dedicated funding sources, complicated governance and ownership structures, expansive networks of aging assets, increasingly stringent water quality regulations, and concerning climate change projections, the expected performance of stormwater systems is declining. Many of the country’s legacy stormwater systems are struggling with the high cost of retrofits needed to address urban flooding and climate change. Upgrading large networks of aging systems underneath densely populated areas carries significant costs and engineering challenges.
Freight
The multimodal freight network is responsible for delivering goods to our doors and supports our ability to comply with social distancing practices. Our inland waterways, ports, and rail systems—along with our bridges and roads—also enable imports and exports to keep us competitive in the global marketplace. The multimodal freight system has middling results in the 2021 Report Card for America’s Infrastructure.
The Mississippi River and its tributaries, as well as the Columbia, Sacramento, and San Joaquin Rivers on the West Coast, make up nearly 12,000 miles of navigable waterways—the U.S. freight network’s “water highway.” Inland waterways infrastructure includes locks and dams as well as navigation channels. The system earned a D+ in 2021, up slightly from 2017.
Recent boosts in federal investment and an increase in user fees have begun to reverse decades of declining lock and dam conditions, with unscheduled lock closures reaching a 20-year low in 2017. While this is encouraging, the system still reports a $6.8 billion backlog in construction projects and ongoing lock closures—totaling 5,000 hours between 2015 and 2019—harming the industries that rely on the waterways to get their goods to market. The U.S. Department of Agriculture estimates delays cost up to $739 per hour for an average tow, or $44 million per year.
Ports and rail earned the highest grades in the 2021 Report Card for America’s Infrastructure, with a B– and B, respectively. The nation’s more than 300 coastal and inland ports are significant drivers of the U.S. economy, supporting 30.8 million jobs in 2018 and 26% of the total GDP. Ports and port tenants plan to spend $163 billion between 2021 and 2025, up by over $8 billion in the last four years. Investments are focused on capacity and efficiency enhancements as maximum vessel size has doubled over the last 15 years, and tonnage at the top 25 ports grew by 4.4% from 2015 to 2019.
Federal funding has increased through multimodal competitive grant programs. However, there is a funding gap of $15.5 billion for waterside infrastructure such as dredging over the next 10 years, with additional billions needed for landside infrastructure. Smaller and inland ports are especially challenged to maintain their infrastructure and have difficulty competing for federal grants. Meanwhile, a port’s success is reliant on the infrastructure outside of its gates, which is often congested or in poor condition. For example, just 9% of intermodal connector pavement—the portions of roadway that connect a port to other modes—is in good or very good condition.
Our nation’s rail network is divided into two categories: freight rail and passenger rail. Approximately 140,000 rail miles are operated by freight’s Class I, II, and III railroads. Amtrak operates over a 21,400-mile network, 70% of which is owned by other railroads, also known as host track. Despite freight and passenger rail being part of an integrated system, there remain stark differences in the challenges faced by the two rail categories. While freight maintains a strong network largely through direct shipper fees—investing on average over $260,000 per mile—passenger rail requires government investment and has been plagued by a lack of federal support, leading to a current state of good repair backlog at $45.2 billion. Along our nation’s busiest passenger rail corridor, the Northeast Corridor, infrastructure-related issues caused 328,000 train-delay minutes, or the equivalent of roughly 700 Northeast Regional train trips from Boston, Mass., to Washington, D.C.
Energy
In a digital, connected world, Americans increasingly rely on readily available and uninterrupted electricity. Over the last four years, transmission and distribution and reliability-focused pipeline investments have increased, and outages have declined slightly. Annual spending on high-voltage transmission lines grew from $15.6 billion in 2012 to $21.9 billion in 2017, while annual spending on distribution systems—the “last mile” of the electricity network—grew 54% over the past two decades. Utilities are taking proactive steps to strengthen the electric grid through resilience measures. However, weather remains an increasing threat. Among 638 transmission outage events reported from 2014 to 2018, severe weather was cited as the predominant cause. Additionally, distribution infrastructure struggles with reliability, with 92% of all outages occurring along these segments.
In the coming years, additional transmission and distribution infrastructure, smart planning, and improved reliability are needed to accommodate the changing energy landscape, as delivery becomes distributed and renewables grow.
Economic implications
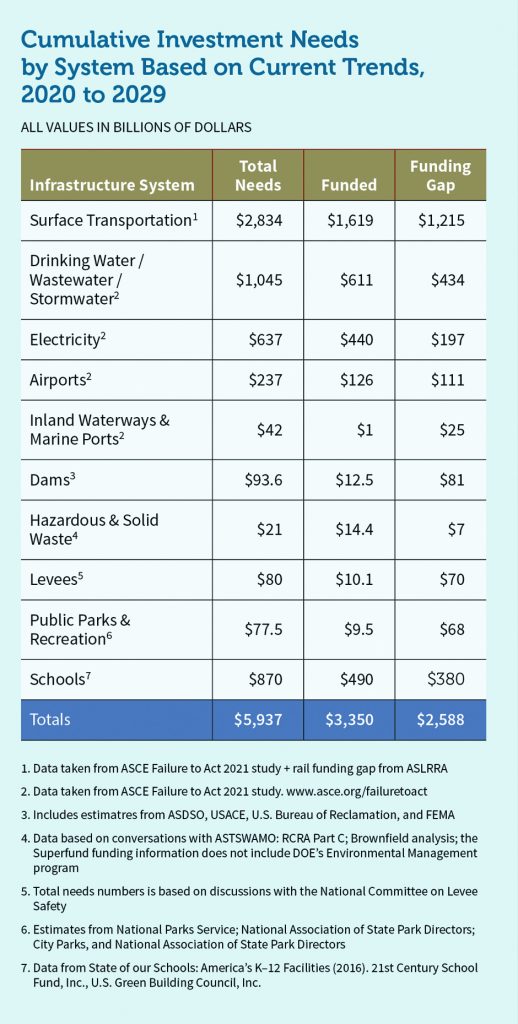
ASCE not only assigns grades, but also calculates the total investment required to bring our infrastructure back to a state of good repair. Between now and 2029, the report estimates that an additional $2.59 trillion—or $259 billion a year—above current spending levels is needed to modernize our systems.
Failing to close this infrastructure investment gap brings serious economic consequences. According to ASCE’s latest economic study, Failure to Act, if we do not address the infrastructure investment gap, our economy will lose $10 trillion in gross domestic product (GDP), more than $23 trillion in total output, and more than 3 million jobs by 2039—two times the number of Walmart employees in the U.S.

U.S. manufacturers are especially vulnerable to underinvestment because the production of goods—such as cars, chemicals, foods, and metals—requires energy, water, transportation systems, and ports for those goods to be made and shipped, including to international markets.
Further, this chronic underinvestment has real-world consequences for American households. Time lost waiting for the subway or train, money spent on unanticipated car repairs resulting from rough roads, and spoiled food due to electricity outages all hurt our pocketbooks. On average, a household will lose $3,300 annually over the next 20 years due to underperforming infrastructure.
How do we move forward?
It’s a simple equation: When we invest, we see results. This is the first ASCE report card to give a cumulative grade above the D range in 23 years. Five categories—aviation, drinking water, energy, inland waterways, and ports—benefitted from increased federal funding and upgrades were made.
However, 11 categories are still in the D range. Moving forward, ASCE urges bold leadership and action, sustained investment, and a focus on resilience to raise the national infrastructure grade over the next four years, so that every American family, community, and business can thrive.
Leadership and action must include incentivization of asset management and encourage the creation and utilization of infrastructure data sets. We must also streamline the project permitting process across infrastructure sectors, while ensuring appropriate safeguards and protections are in place.
If the United States is serious about achieving an infrastructure system fit for the future, some specific steps must be taken, beginning with increased, long-term, consistent investment. To close the $2.59 trillion 10-year investment gap, meet future need, and restore our global competitive advantage, we must increase investment from all levels of government and the private sector from 2.5% to 3.5% of GDP by 2025. This investment must be consistently and wisely allocated.
And finally, we must utilize new approaches, materials, and technologies to ensure our infrastructure can withstand or quickly recover from natural or man-made hazards.
Members on both sides of the political aisle agree we need to improve our infrastructure, and now is the time to act. President Joe Biden unveiled his American Jobs Plan on April 1 that suggests transformational and meaningful investment in our transit systems, energy grid, and more. Congress must act on these recommendations to keep us competitive abroad and improve the quality of life here in the U.S.
ANNA DENECKE is director of infrastructure initiatives for the American Society of Civil Engineers.