
By Ben Abbott and Brian Lanzrath
The changes to daily life and the uncertainty brought on by the COVID-19 pandemic continue to have impacts on the mental and physical health of populations around the world. One health impact often attributed to the COVID-19 pandemic is weight gain due to decreased activity and indulgence in “comfort foods.” This weight gain is sometimes referred to as “the COVID 15” on social media. Weight gain can lead to increased risk factors such as hypertension, diabetes, hypercholesterolemia, and hyperlipidemia.
To assess the statistical validity of weight gain claims and other biometric and clinical changes during the COVID-19 pandemic, we at ExamOne analyzed data from paramedical examinations for life insurance applicants before and after the onset of the COVID-19 pandemic in the United States. This analysis of weight gain during the COVID-19 pandemic aims to provide an evidence-based assessment of the conventional wisdom that American waistlines expanded during the COVID-19 pandemic.
Long-Term BMI Trends Within the General Population
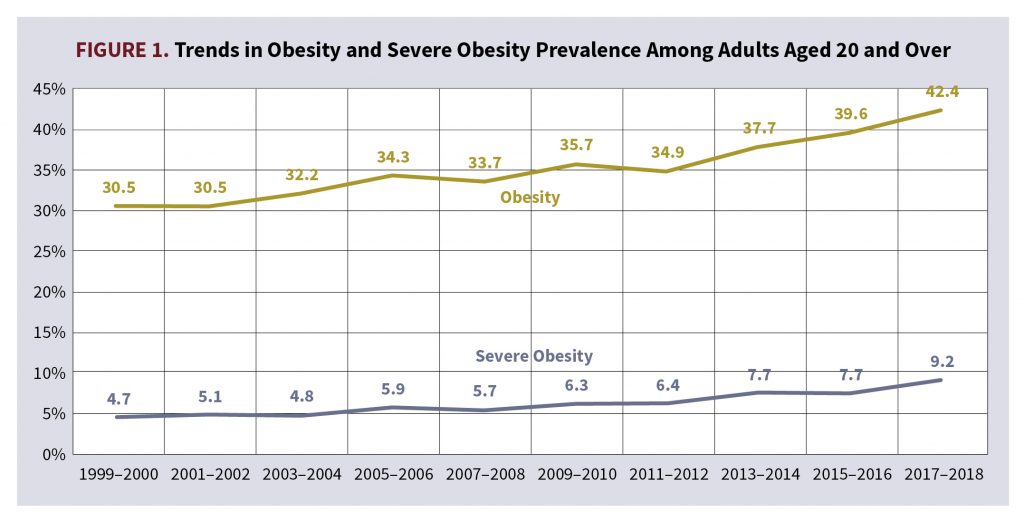
Figure 1 shows that obesity and severe obesity have seen a statistically significant linear upward trend from 1999 through 2018 among American adults aged 20 and over. The Centers for Disease Control and Prevention (CDC) defines obesity as having a body mass index (BMI) greater than or equal to 30 and severe obesity as having a BMI greater than or equal to 40. In total, the prevalence of obesity among all U.S. adults over the age of 20 has increased by more than 10 percentage points between 1999 and 2018.1
BMI Trends Within the Life Insurance Population of ExamOne
To determine whether average BMI in ExamOne’s United States life insurance applicant population saw a statistically significant increase after the start of the COVID-19 pandemic, we calculated BMI from height and weight measurements taken during more than 5 million paramedical exams between March 1, 2017, through March 31, 2021. Applicants considered were between the ages of 18 and 79 at the time of their exam, with policy sizes between $5,000 and $10 million. We considered the start of the COVID-19 pandemic response in the U.S. to be March 1, 2020, and all exams taken on or after this date to be called “post-pandemic.” Exams taken before March 1, 2020, are referred to as “pre-pandemic.” Although different levels of response were enacted on different dates for national, state, and local governments, March 1 was selected as a general benchmark for ease of interpreting what qualifies as the pre-pandemic and post-pandemic periods in the United States. Height in inches and weight in pounds was collected for all paramedical exams in this study and BMI was calculated using these measurements.
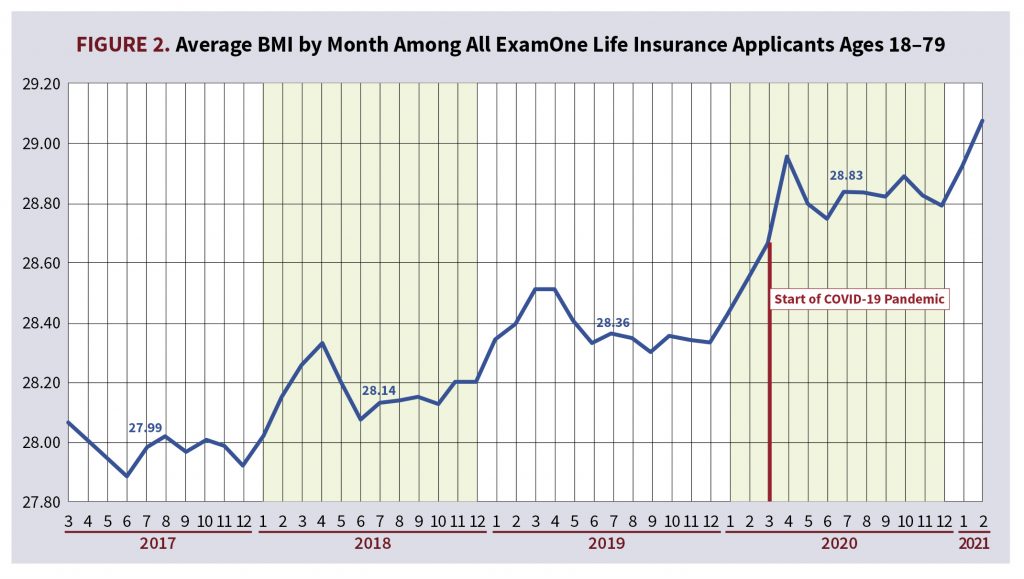
Taking a high-level look at monthly trends in average BMI among ExamOne life insurance applicants across all ages from March 2017 through March 2021, a stair-step seasonal pattern seemingly emerges of increasing BMI during January, February, March, and April, which then levels off to a new high plateau through the summer months (Figure 2). If we narrow the focus to January 2020 through April 2020, it appears there is a bigger stair-step up than previous years and the new plateau for the summer months of 2020 is higher than we would expect given previous years’ trending. Compare a 0.22 increase in average BMI between July 2018 (with an average BMI of 28.14) and July 2019 (with an average BMI of 28.36) to a 0.47 increase in average BMI between July 2019 (with an average BMI of 28.36) and July 2020 (with an average BMI of 28.83).
However, is this observable increase in BMI statistically significant? If this increase in BMI is statistically significant, is this upward trend during the pandemic greater than the increasing linear trend that we’ve seen in previous years? To answer these questions, let us first look at the demographics of the underlying populations pre- and post-pandemic.
Analyzing Demographics of the Life Insurance Population
To test our hypothesis that the COVID-19 pandemic had an impact on BMI among the life insurance applicant population, we broke the study population into six cohorts.
- F1 Cohort: Females aged 18-39
- F2 Cohort: Females aged 40-59
- F3 Cohort: Females aged 60-79
- M1 Cohort: Males aged 18-39
- M2 Cohort: Males aged 40-59
- M3 Cohort: Males aged 60-79
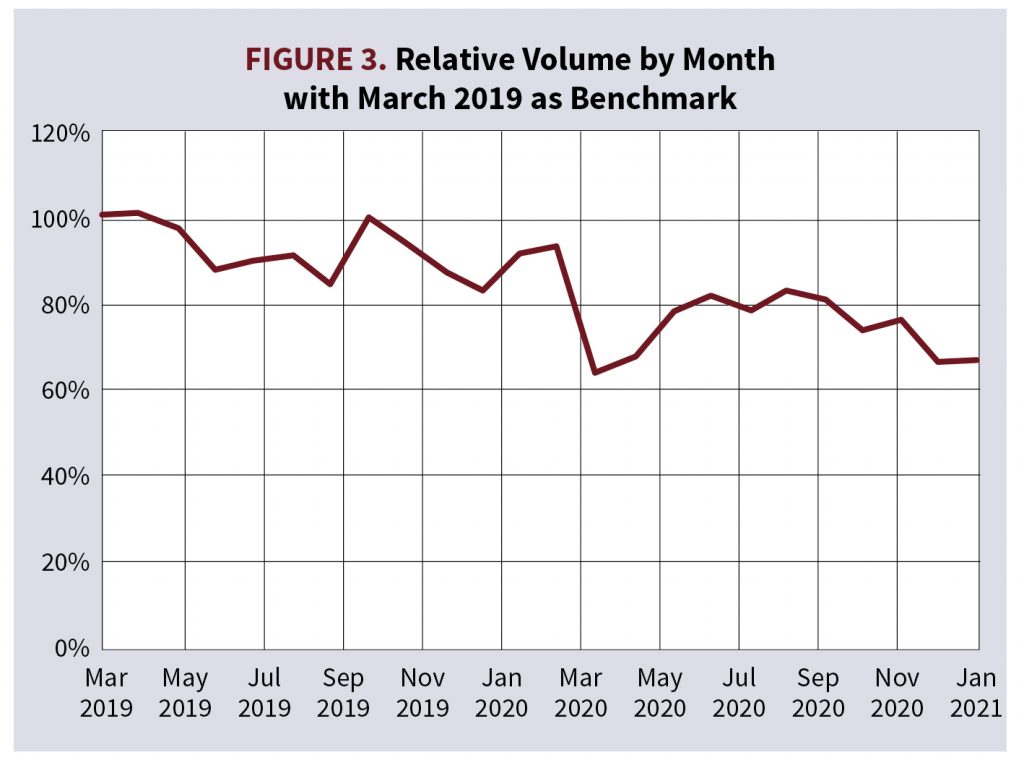
Tables 1A and 1B show a breakdown of the mean and median ages and requested policy amounts by cohort. It is important to note that ExamOne saw a drop in life insurance applicant volume following the start of the COVID-19 pandemic around April 2020, but slowly returned to normal volumes (Figure 3).
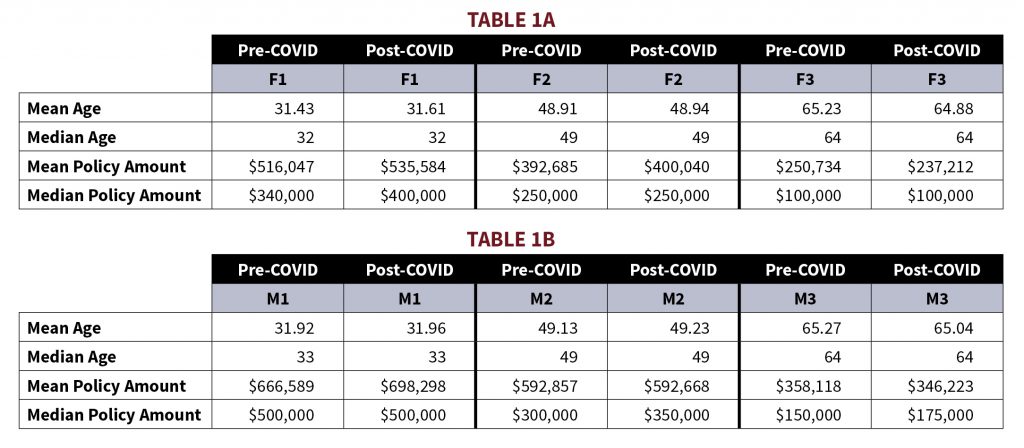
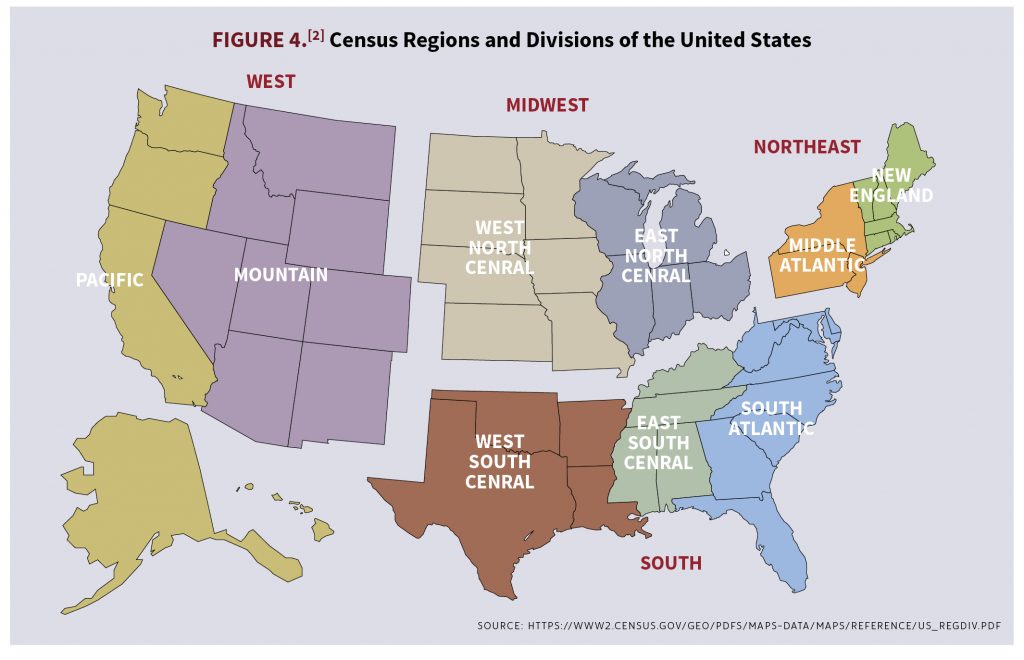
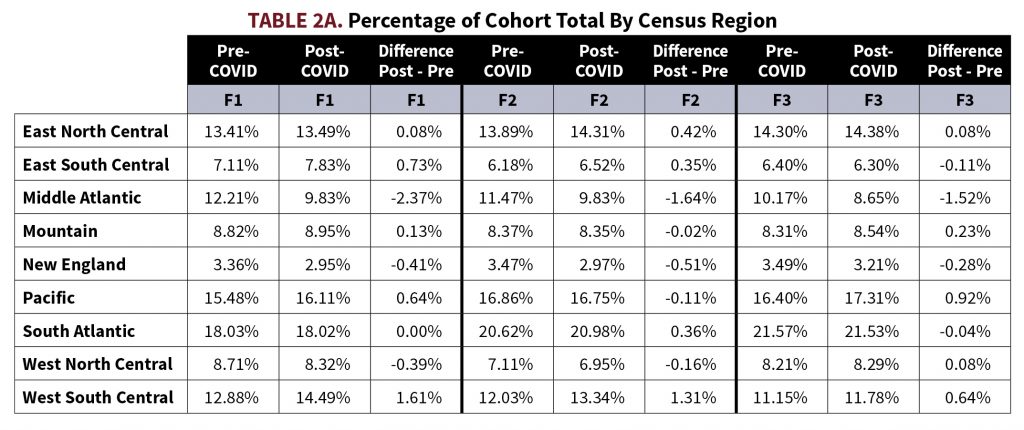
It is a possibility that the observed increase in BMI is a selection effect precipitated by a different demographic makeup of applicants applying for life insurance post-COVID-19 as opposed to pre-COVID-19. To check to see whether a selection effect may be impacting the population, we analyzed three metrics that have a strong correlation to an applicant’s BMI: requested policy amount, applicant age, and applicant state. Looking through tables 1A and 1B, there were small increases to mean and median policy amounts in the F1, F2, and F3 cohorts and small decreases to mean and median policy amounts in the M1, M2, and M3 cohorts. Mean and median ages saw very little change among all cohorts. In tables 2A and 2B, applicant home address states are divided into census regions and these regions’ relative percentage of the total respective cohort pre- and post-COVID-19 are listed. The region with the largest decrease in percentage of total population for all 6 cohorts was the Middle Atlantic, with decreases ranging between 0.87% and 2.57%. For cohorts F1, F2, M1, M2, and M3, the West-South-Central region saw the largest increase in percentage of total population, ranging between 0.68% and 1.61%. F3 saw the largest increase in percentage of total population in the Pacific region with an increase of 0.92%.

Modeling BMI with Linear Regression
We included the variables of age, policy amount, and state in linear regression models for each cohort to control for whether the changes in population pre-COVID-19 and post-COVID-19 were significant. All 50 states and the District of Columbia were included as Boolean variables; U.S. territories were not included in the dataset. Year was included as a variable to account for the secular trend of increasing BMI in the U.S. population. Additionally, month names were coded as Boolean variables to account for seasonality seen within BMI values. Most importantly, a Boolean variable indicating whether the BMI measurement was taken during the pre-pandemic era (before March 1, 2020) or during the post-pandemic era (March 1, 2020, and later) was included. We ran linear regression for each cohort modeling BMI as a function of these variables with stepwise selection and an indicated significance of P ≤ 0.025. Table 3 shows the significant selected coefficients for the time variables from each cohort.
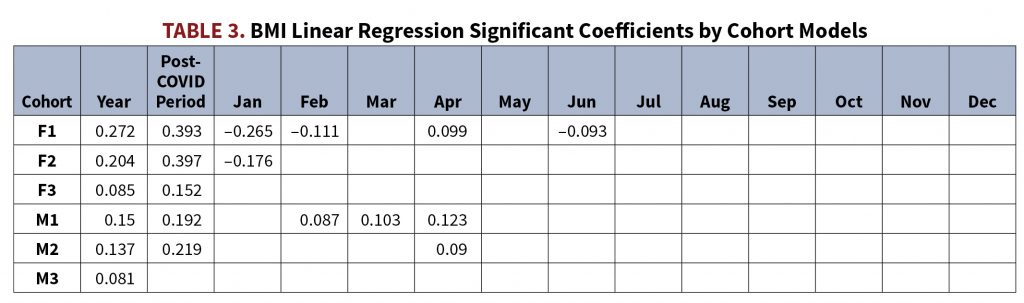
The variable year was selected as a positive significant coefficient for all 6 cohorts, indicating a significant increasing trend in BMI year-over-year. The post-pandemic period Boolean was selected as a positive coefficient for all cohorts except M3. Additionally, these post-pandemic period coefficients are larger than the year variable coefficients for all 5 cohorts where they were selected. Regarding our question of whether BMI increased in a statistically significant way during the COVID-19 pandemic, these models seem to indicate that there is indeed a statistically significant increase of BMI during the pandemic and that this increase is larger than linear trends we’ve seen of increasing BMI in past years, at least for women ages 18-79 and men ages 18-59.
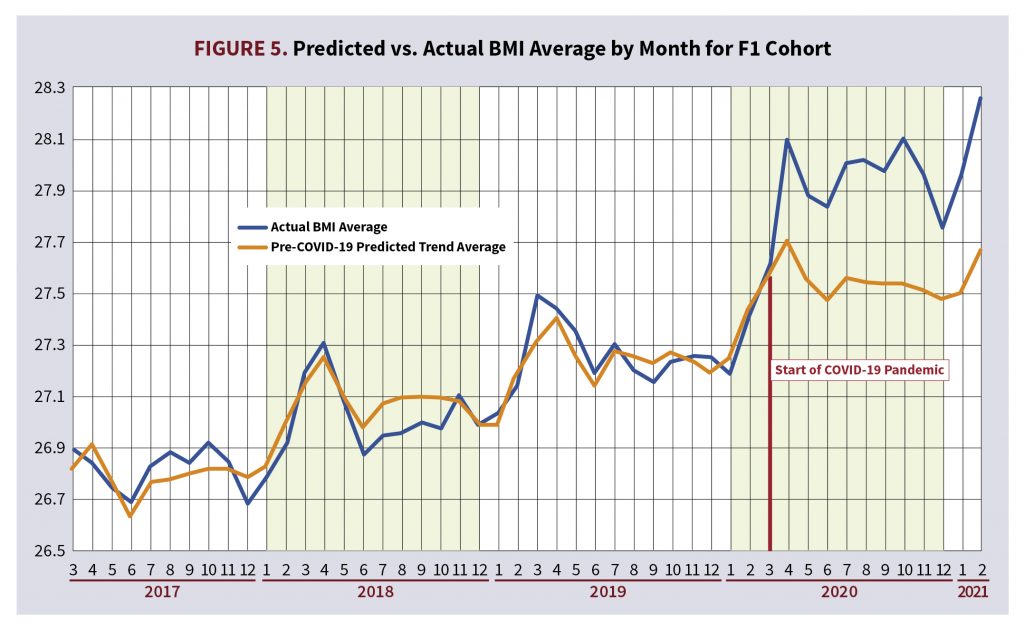
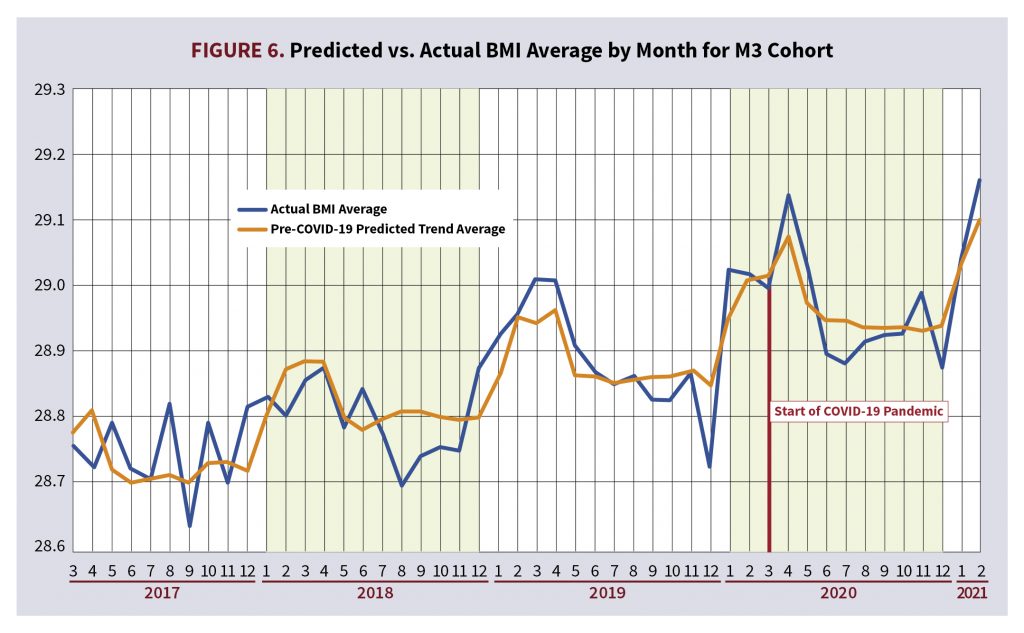
To gain a further understanding of how these models capture the impact the COVID-19 pandemic had on average monthly trending BMI, we used these linear regression models to predict BMI for each applicant in the study and plotted the average monthly predicted BMI alongside the actual average monthly BMI for each cohort. However, the coefficient for the post-COVID-19 period variable was purposely left out when calculating these predictions to highlight within the graphs the impact of the predictive power of the COVID-19 pandemic on the BMI of the population. The impact of the pandemic is the most pronounced within the F1 cohort; this was the cohort that had the largest positive significant coefficient for the post-COVID period. Figure 5 shows the actual average monthly BMI alongside the COVID-19 prediction of average monthly BMI that specifically removed the post-COVID-19 period coefficient for the F1 cohort. Within Figure 5, the predicted trendline begins to diverge from the actual BMI monthly average values beginning around March 2020, or the beginning of the COVID-19 pandemic. Compare this trend in Figure 5 to Figure 6, which depicts the M3 cohort. Figure 6 is a similar graph to Figure 5, but the predicted trendline does not diverge from the actual monthly BMI average values because the COVID-19 period was not selected as a significant variable for this cohort.
Analyzing the Impact of the COVID-19 Pandemic on Other Numeric Labs or Measurements
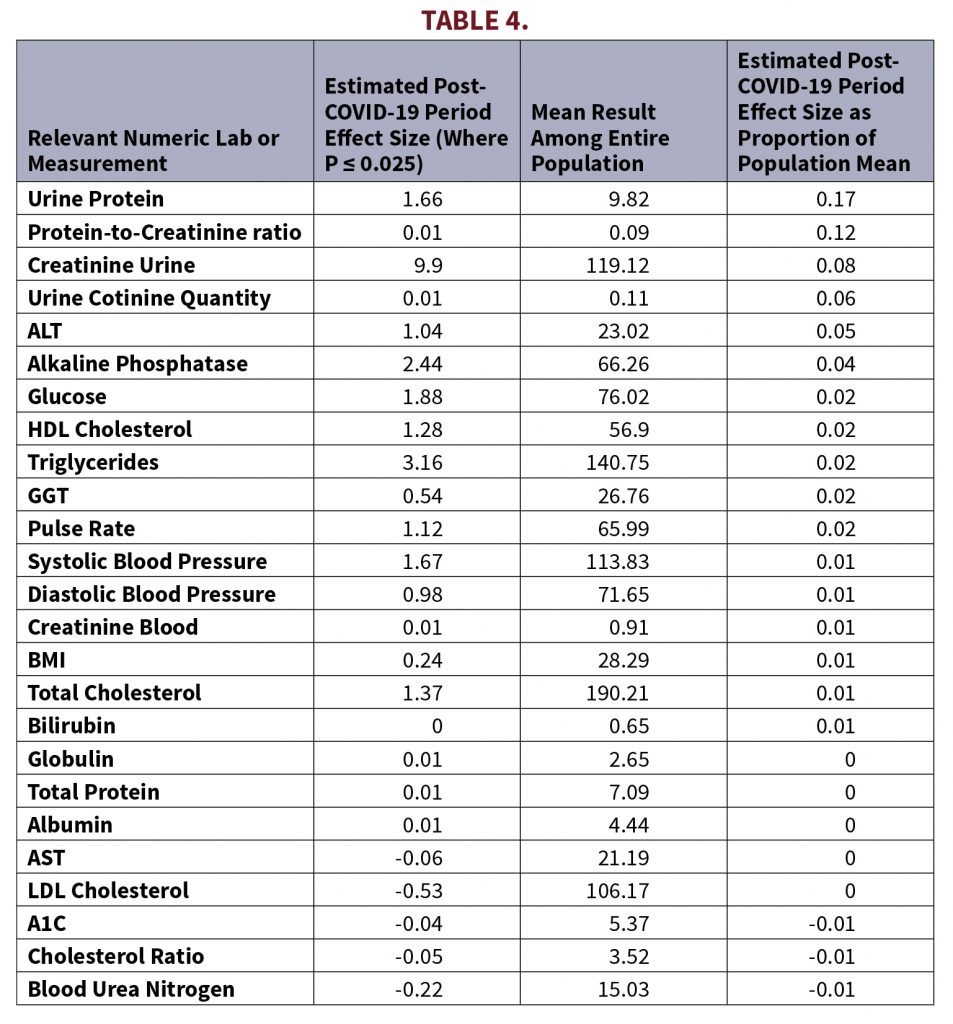
In addition to height, weight, and BMI, there are many other measurements taken during paramedical exams. As a follow-up, we ran similar linear models using similar variables against all numeric labs and measurements collected within standard paramedical exams. These linear models were run across all applicants rather than by cohort. Table 4 shows paramedical labs that had significant COVID-19 period effects. It is interesting to note that Table 4 shows that the absolute size of the effect on BMI from the COVID-19 pandemic was 1% looking at the entire population. Other measurements such as urine protein and creatinine had even larger effects, and it may be worth investigating these labs or measurements further.
Summary
There does seem to be some statistical evidence for the conventional wisdom that widespread weight gain in the insurance population (measured with BMI) was accelerated during the COVID-19 pandemic, especially among younger women. However, the absolute size of the effect was a modest 1%. Other physical and laboratory metrics also appear to have been affected, especially urine protein and creatinine.
As the world continues to respond to the impact of the novel coronavirus, it may be worth continuing to monitor trends that may lead to increased risk factors for insurers.
BEN ABBOTT is a data scientist at ExamOne. BRIAN LANZRATH is director of analytics at ExamOne.
Sources
Hales CM, Carroll MD, Fryar CD, Ogden CL. Prevalence of obesity and severe obesity among adults: United States, 2017–2018. National Center for Health Statistics. NCHS Data Brief No. 360; February 2020. https://www.cdc.gov/nchs/products/databriefs/db360.htm
Hales, et al. NCHS. Data table for Figure 4. Trends in age-adjusted obesity and severe obesity prevalence among adults aged 20 and over: United States, 1999–2000 through 2017–2018. https://www.cdc.gov/nchs/data/databriefs/db360_tables-508.pdf#page=4
U.S. Census Bureau. 2010 Census Regions and Divisions of the United States. Revised October 8, 2021. https://www2.census.gov/geo/pdfs/maps-data/maps/reference/us_regdiv.pdf