

Understanding the death toll from the COVID-19 pandemic
By Alan J. Tausch
Since its outbreak in early 2020, the COVID-19 pandemic has had an unprecedented impact on mortality in the U.S. Through August 2022, there had been 1,048,000 deaths attributed to COVID-19 infection, according to the Centers for Disease Control and Prevention (CDC), which collects data on all deaths in the United States. The CDC data is essentially the same as the death count tracked by the on-line dashboards (Johns Hopkins, Worldometers, etc.), and this is the death toll figure that has gotten the most attention in the news.[1]
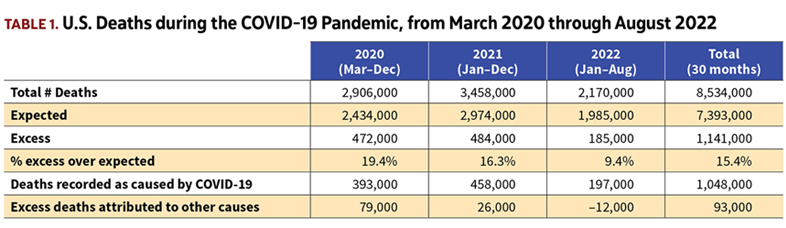
Another, less widely publicized metric of pandemic mortality is “excess deaths,” which is the total number of deaths in excess of what would be expected based on recent years’ trends. By this measure, there have been 1,141,000 excess deaths over the period March 2020 through August 2022[2] relative to the 7,393,000 deaths that would be expected.[3] This means that total mortality in the United States during the pandemic has been 15% higher than normal—an extraordinary impact, unmatched by any other event in the years since World War II.
The difference between the two measures says that there were 93,000 excess deaths not documented as having been caused by COVID-19 infection on the death certificate. What are the causes of these excess deaths, and how do they relate to the pandemic?
Table 1 breaks total U.S. deaths among the three calendar years spanned by the pandemic: 2020 from March on (10 months); all of 2021 (12 months); and 2022 through August (8 months).
In each of the three years, deaths have been significantly above expected. But the gap between excess deaths and those attributed directly to COVID-19 has varied considerably over time.
We can expand this and look more closely at the pattern over time among the excess deaths. The graph in Figure 1 shows the deaths on a week-by-week basis.[4] Apart from a few weeks in early 2021 and again in early 2022, deaths have been significantly in excess of expected throughout the pandemic period.
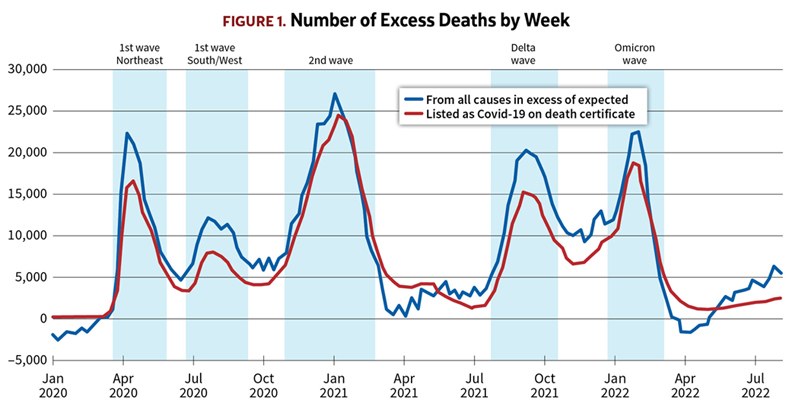
As Figure 1 illustrates, the deaths from COVID-19 have come in waves, with the majority of them occurring during five peak periods, indicated by the shading in Figure 1:
- The first peak followed a severe wave of infections concentrated mainly in the Northeastern United States, including New York City, in the spring of 2020.
- This was followed by second peak as the first wave of infection hit the populous Southern and Western states in the summer of 2020.
- The winter of 2020–21 saw a second wave of virus transmission, this time affecting the whole country.
- The rollout of vaccines in the early months of 2021 suppressed both the rate of transmission and lethality, but the delta variant set off another wave of deaths in the fall of 2021.
- And finally there was the omicron wave over the winter of 2021–22.
It’s readily apparent from the graph that the successive COVID-19 waves account for most of the excess deaths. However, that still leaves a significant residual of excess deaths beyond those attributed to COVID-19 on the death certificate.[5]
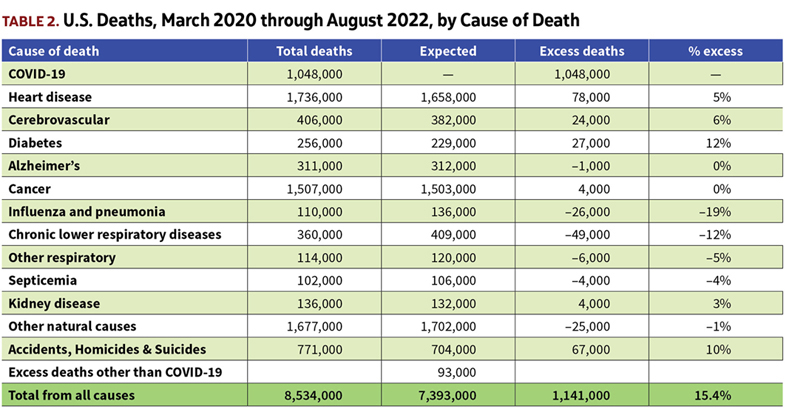
The CDC tabulates all deaths by cause of death, and reports it at weekly intervals.[6] Table 2 shows the total and excess deaths for the leading causes of death since the start of the pandemic.
Broadly it indicates that deaths attributed to heart disease, stroke, and diabetes have been higher than normal during the pandemic period. Deaths from influenza and other respiratory conditions have been below normal. Accidents, homicides, and suicides have been above normal.
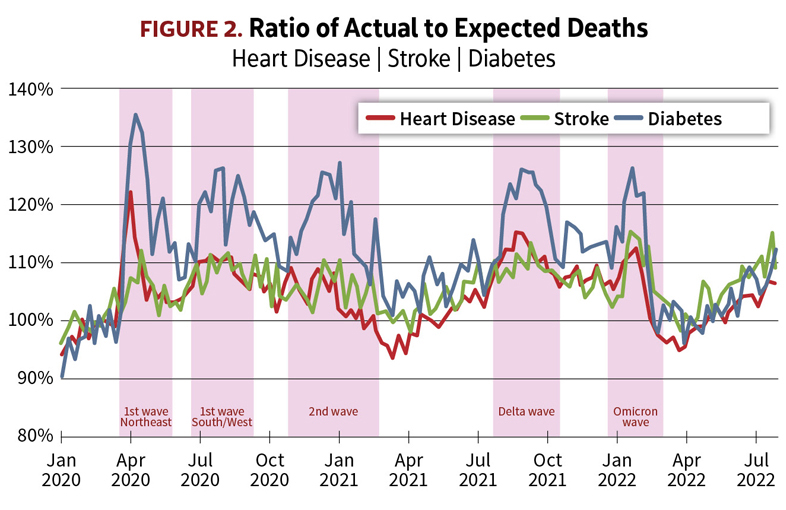
We can get further insight into the effects of the pandemic on mortality by looking at the patterns over time among the deaths by cause, shown in the series of graphs in figure 2–6.
Beginning with the chart for heart disease in Figure 2, we see that deaths attributed to heart disease have been above normal during most of the pandemic period. But a striking feature is that the actual-to-expected ratios show distinct peaks coinciding with the waves of COVID-19 deaths. Clearly, the elevated level of deaths attributed to heart disease is not due to a sudden increased prevalence of heart disease, nor has medical treatment for heart problems become any less effective. Rather, COVID-19 infections resulted in death among people with pre-existing heart disease, even though COVID-19 was not always recorded as a contributing cause on the death certificate. Without a doubt, some of these deaths involving heart disease and COVID-19 together would have occurred anyway in the absence of COVID-19 infection, but the arrival of COVID-19 resulted in more deaths than there would have been from heart disease alone.
The same dynamic is evident in the stroke and diabetes deaths. As seen in Figure 2, deaths attributed to strokes and diabetes have been higher than expected throughout the pandemic, and again the A/E’s are most elevated during the surges in deaths from COVID-19.
Cardiovascular disease, diabetes, and obesity are all well-known as comorbidities for increased risk of severe disease and death from COVID-19. Some of these individuals, especially if they had died at home, might not have been tested for COVID-19. Even when COVID-19 was suspected, the certifying physician would not necessarily have put it down as a contributing cause on the death certificate if the person was known to have one of the comorbidities.
Evidently, COVID-19 infection (whether confirmed or not) was the driver of the excess deaths. Attributing the excess mortality to heart disease, stroke, or diabetes simply on the basis of what was noted on the death certificate obscures the true cause. It would be more accurate to say that the COVID-19 pandemic has resulted in increased mortality among those with comorbidities.
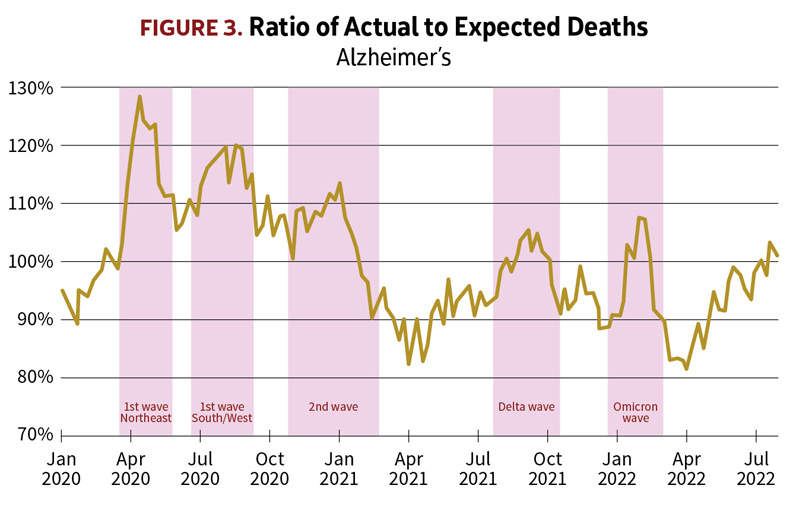
The chart in Figure 3 showing deaths among people with Alzheimer’s also features distinct peaks corresponding to the waves of COVID-19 infection. Here again, as with other co-morbidities, the pandemic resulted in deaths among Alzheimer’s patients—not all of which were attributed to COVID-19 on the death certificate.
But what’s noticeably different in the case of Alzheimer’s is that the heaviest death toll occurred early in the pandemic. Many Alzheimer’s patients were confined to nursing homes and other care facilities, and despite measures taken to limit transmission some facilities experienced COVID-19 outbreaks with high resident mortality when the virus was inadvertently introduced by visitors and staff, especially before testing for COVID-19 was widely available. Many facilities were impacted by staffing shortages leading to reduced levels of care. And in addition, the stress brought on by mitigation measures and isolation from family may have contributed to the increased mortality in this vulnerable population, even among patients who did not contract COVID-19. The result was a sharp spike in deaths during the first wave in April and May 2020, and deaths among Alzheimer’s patients continued to run above expected through the end of 2020.
But because of their advanced age and the underlying disease, this is a population with a very high mortality rate even in normal times. Even though Alzheimer’s deaths still show prominent peaks during the delta and omicron waves, during much of 2021 and 2022 there were actually fewer deaths than expected because many of the deaths that would have been expected then had already occurred in the first waves in 2020. So, the outbreak of the pandemic unfortunately accelerated the deaths of some people with Alzheimer’s, causing them to occur earlier than they otherwise would have, but it may not have substantially increased the number of deaths for the pandemic period overall.
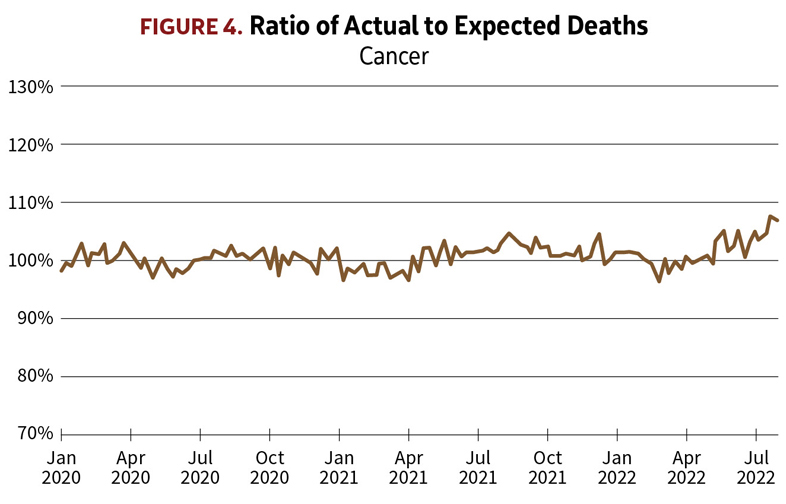
In contrast, cancer deaths (Figure 4)have remained close to their normal expected numbers throughout the pandemic, and they show no correlation with the waves of COVID-19 infections. I found this surprising in light of the cardiovascular and diabetes statistics; one would expect that people under treatment for cancer would be especially vulnerable to COVID-19 infection. I’m speculating, but it may reflect that patients being treated for cancer would have been kept more scrupulously isolated from exposure to COVID-19 infection than the general population. Probably they were more diligently tested for COVID-19 as well, so that if a cancer patient did catch the disease and died from it, it would have been recognized and recorded as caused by COVID-19 and not by cancer.
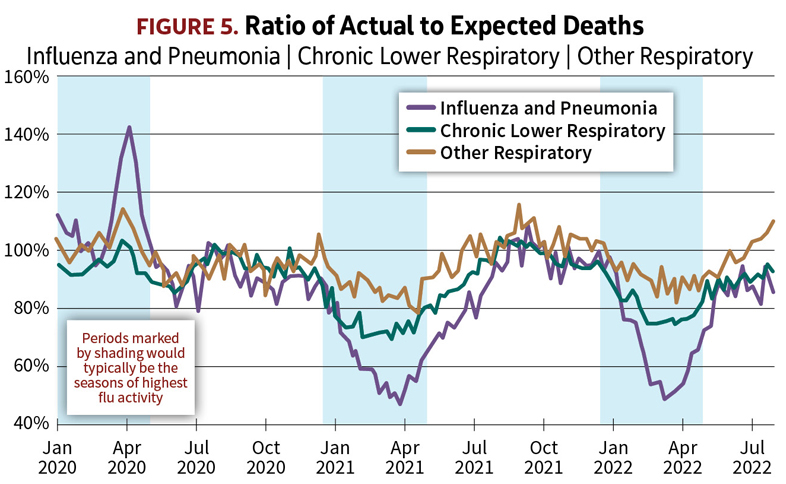
On the chart of the A/E’s for influenza and pneumonia (Figure 5), a prominent peak shows up coinciding with the start of the coronavirus pandemic, in March and April 2020. This sudden surge in excess deaths was actually the start of the first wave of COVID-19 in the U.S. During this brief period before testing for COVID-19 became widely available, many of those who succumbed to the novel coronavirus, especially if their death occurred at home, were simply recorded as pneumonia, if COVID-19 was merely suspected but not confirmed by a lab test. After April 2020, however, as testing became widespread and routine, we see that deaths from respiratory ailments other than COVID-19 have been well below normal.
Normally most deaths from influenza occur during a season that extends through the winter from December to April, indicated by shading on the graphs. Flu seasons vary widely in their severity from one year to the next, making flu the single biggest cause of year-to-year fluctuations in overall mortality. The 2020–21 and 2021–22 flu seasons were both among the mildest on record. As seen on the graphs, deaths from flu and pneumonia during the two most recent winter seasons fell as low as 50% of what would be expected based on the average flu seasons of previous years.
But that’s not all. The reduction in respiratory mortality is most striking for flu and pneumonia, but there are also very significant reductions for chronic obstructive pulmonary disease (COPD) and other respiratory conditions. The graphs for both show markedly fewer deaths compared with expected during these winter periods when contagious diseases would most readily have been circulating.
What this reveals is that—contrary to some widespread misunderstanding among the public—the mitigation measures taken by the population (masking, social distancing, reduced travel, school closures, remote working arrangements, suspension of events involving large crowds) were quite effective in also suppressing the transmission of respiratory infections besides COVID-19.
This is the silver lining to the COVID-19 pandemic—81,000 fewer deaths from flu, pneumonia, and other respiratory diseases. Amid the carnage of COVID-19 deaths, these were lives saved as a result of the mitigation measures.
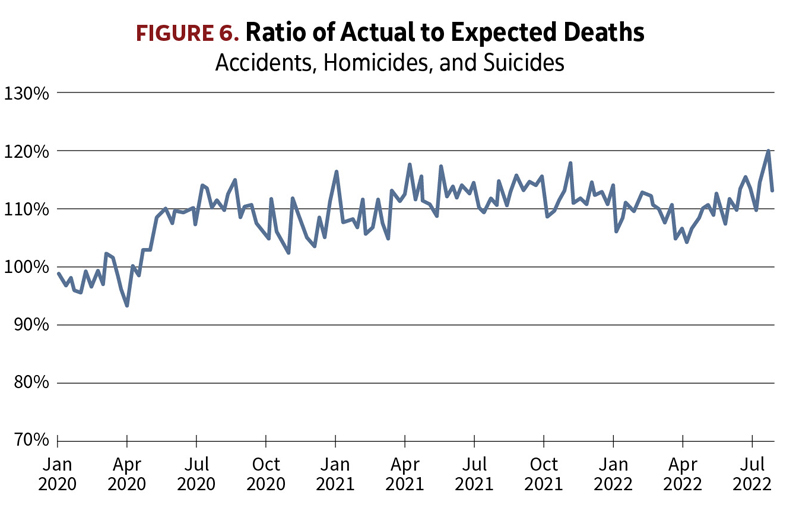
The Figure 6 graph of deaths from accidents (including accidental drug overdoses), homicides, and suicides tells a very different story. The striking feature is the abrupt uptick coinciding with the start of the pandemic. From then on, these deaths have stayed stubbornly elevated by about 10% above the levels of prior years, piling up 67,000 excess deaths since April 2020.
Motor vehicle fatalities,[7] homicides,[8] and drug overdose deaths[9] have all been significantly higher than they were before the pandemic. The obvious question is to what extent the increases in deaths from these various causes are a side effect of the pandemic, and to what extent they’re just coincidental. The timing of the uptick is suggestive, but apart from that, the pattern of the A/E’s doesn’t give any clues. Certainly there is no noticeable correlation over time with the waves of COVID-19.
Some researchers have attributed increases in homicides and drug overdoses to the psychological effects of isolation brought on by the COVID-19 mitigation measures and other disruptions to normal patterns of life. On the other hand, a large proportion of the accidental drug overdoses in recent years have been due to fentanyl mixed in with drugs supplied from overseas to users in the U.S.—a phenomenon that seems to have little to do with with the COVID-19 pandemic.
The driving forces behind the uptick in these deaths are not clear and are undoubtedly complex. Regardless of whether the rise has roots in the social upheaval of the pandemic, unlike deaths from disease, most of these are deaths which are inherently avoidable. Suffice it to say that as a society we need to gain a better understanding of the reasons behind the rise in these deaths and work to reverse it.
In summary, since the start of the pandemic in the U.S. in March 2020, 1,048,000 deaths can be directly attributed to COVID-19 infection by way of the cause given on the death certificate. But the true death toll is broader than that because not all of the infections that resulted in deaths involving other comorbidities had COVID-19 recorded as a contributing cause of death. The patterns of the A/E’s are strong evidence that COVID-19 infections account for substantially all of the 128,000 excess deaths attributed to heart disease, stroke, and diabetes, bringing total pandemic-caused deaths to 1,176,000.
In addition, the social upheavals of the pandemic have probably played some role in the 67,000 excess deaths from accidents, homicides, and suicides, though how much is unclear.
On the other side of the ledger, an indirect consequence of the pandemic has been 81,000 fewer deaths from respiratory diseases other than COVID-19, as the mitigation measures taken against transmission of COVID-19 the virus have had the side benefit of also suppressing the prevalence of flu and other contagious diseases.
What can we say about the impact of the COVID-19 pandemic on mortality going forward? While no one can predict the future trajectory, it is clear that we should not expect mortality to return fully to the pre-pandemic level anytime soon. For the past several months, COVID-19 deaths in the U.S. continue to run at about 400-500 a day, or an annual pace of 160,000 deaths a year. That translates to about 5% above normal expected mortality, making COVID-19 still the third leading cause of death (behind heart disease and cancer).
The big unknown is the possibility of further variants arising and bringing with them future waves of infection and deaths. The virus has already demonstrated its propensity to mutate and become resistant to immunity built up through vaccination and prior infection.
But even beyond the deaths that may result from future COVID-19 infections, there are warning signs that the pandemic of the past two years has left changes that may adversely affect mortality going forward. From early on in the pandemic, health professionals have noted their concern that in their effort to avoid COVID-19 exposure, many people have put off routine medical checkups, including cancer screenings, and that consequently we may begin to see more cancers being detected at more advanced stages. It’s too soon for it to have shown up yet in the cancer death statistics, but a delayed effect of the pandemic could be higher rates of cancer mortality in coming years.
Another potential delayed impact is that past COVID-19 infections may have impaired the general health of some people after they recover from the acute phase of the disease. Studies have shown that prior COVID-19 infection is associated with higher prevalence of cardiovascular problems.[10] The pandemic may have left behind a population with a higher burden of cardiovascular disease—and the prospect of higher mortality as a result.
ALAN J. TAUSCH, MAAA, FSA, is an independent consulting actuary located in Connecticut and a former vice president and actuary at Cigna Corporation.
References
[1] In the data compiled by the CDC, deaths counted as being due to COVID-19 are essentially the same as those reported on the online dashboards, except that the timing is different. The dashboards show the deaths daily as they are reported by state and local health departments, which are subject to lags due to administrative processing. The lags vary by jurisdiction and have also varied over time since the start of the pandemic. The CDC data tallies deaths by date of death. [2] For this analysis, the pandemic period is counted from March 1, 2020, onward. There were virtually no deaths recognized as COVID-19 in the U.S. before March 2020. [3] Excess deaths are relative to an expected calculated as the average of actual deaths over the six years 2014 through 2019, trended, and reflecting the normal seasonal variation in deaths. Both trend and seasonality are specific to each cause of death. The aggregate secular trend in number of deaths from all causes combined is about 1.75% per year. The trend reflects both growth in the U.S. population and the aging of the population. [4] Because they are tallied by date of death, the CDC’s counts for recent weeks are incomplete and will rise as more death certificates are received. For this analysis of actual-to-expected deaths, the counts used for most recent weeks have been completed—that is, they compensate for the reporting lag by including estimates of deaths for which CDC has yet to be notified. [5] Following CDC guidelines, both cases of infection and deaths are counted as being from COVID-19 if COVID-19 is either confirmed by lab test, or untested but considered probable. Because many cases of infection are asymptomatic, and many symptomatic cases are identified by home test kits but not reported to health authorities, the case counts on the dashboards greatly underestimate the true extent of infections. Death counts on the other hand should be much closer to their real level, but nonetheless not every death involving COVID-19 is confirmed by testing, and a judgment by the physician that COVID-19 was probable will inevitably miss some. [6] When a death certificate indicates multiple contributing causes, it is grouped according to the cause indicated in the physician’s judgment as the underlying cause of death. [7] For further details see: “Early Estimate of Motor Vehicle Traffic Fatalities in 2021,” National Highway Traffic Safety Administration, Traffic Safety Facts, April 2022. [8] Richard Rosenfeld and Ernesto Lopez, “Pandemic, Social Unrest, and Crime in U.S. Cities: March 2021 Update,” Washington, D.C.: Council on Criminal Justice, May 2021. [9] American Medical Association, Advocacy Resource Center, “Issue brief: Nation’s drug-related overdose and death epidemic continues to worsen,” updated May 12, 2022. [10] Yan Xie; Evan Xu; Benjamin Bowe; Ziyad Al-Aly. “Long-term cardiovascular outcomes of COVID-19,” Nature Medicine, March 2022. [11] Arias E, Tejada-Vera B, Ahmad F, and Kochanek KD. “Provisional life expectancy estimates for 2020,” Vital Statistics Rapid Release No.15, Hyattsville, MD: National Center for Health Statistics, July 2021; and “Provisional life expectancy estimates for 2021,” Vital Statistics Rapid Release No.23, August 2022.