
By R. Evan Inglis
We haven’t come fully to grips with it yet, but our financial world is going through a massive transition that will create challenges for investors in public and private markets. Pension plans, retirement savers, endowments, and foundations—and anyone else who intends to spend some of their invested assets in the future—will eventually have to come to terms with a dramatically different level of investment returns than we have gotten used to.
This new world of returns will be driven by low interest rates, which create high asset prices. Low rates, or more precisely the almost 40-year steady decline—10-year Treasuries went from yielding higher than 15 percent in 1981 to below 2.0 percent and now hover a bit under 3.0 percent—is a “double whammy” for returns. The decline in rates simultaneously increases past returns and drives down the potential for future returns as it pushes up asset prices, creating a huge disconnect between our past experience and the future that is likely before us.
Price & Yield
It’s most natural to think about future equity returns as dependent on current asset prices—i.e., price-to-earnings ratios. It’s more natural to think about future fixed-income returns as dependent on current yields. However, a price is just the inverse of a yield. A price is the value of expected future cash flows based on a discount rate equal to the yield—just like a pension valuation. For equities:
- Price-to-Earnings Ratio = Market Price / Earnings
- Earnings Yield = Earnings / Market Price
The two concepts, yield and price, can be used somewhat interchangeably for any of the key asset classes—fixed income, equities, and real estate.
Many of us understand that returns will be lower in the future, but return expectations are still anchored in our past experience. The world of 8.0 percent portfolio returns seems normal; we’ve lived in it and believed it to be the natural state of things for many years. Our minds have trouble adjusting to the idea that the future will be very different from that “normal” state.
Practical considerations make it hard to accept a future of lower returns as well. Pension plan sponsors have enough challenges with pension costs when they assume portfolio returns of 7.5 percent, let alone a more conservative 5.0 percent. A retiree who would like to spend 4–5 percent of their portfolio may find it hard to stick closer to 3 percent.
Many investors still justify future return expectations with past experience, and the industry press seems to share this perspective. However, the truth is that the higher past returns have been, the lower our expectations for future returns should be. High past returns drive up prices and pull forward returns that we potentially could have experienced in the future. Robin Greenwood and Andrei Shleifer at Harvard wrote a fascinating paper in 2014 showing how our expectations for returns (based on surveys of investors and investment professionals) and rational expected returns based on market information are actually negatively correlated to a significant degree. Expectations for returns are driven by recent experience (high returns drive high expectations), while rational expected returns are driven largely by current prices (high returns create high prices which drive lower future returns).
The negative correlation between future returns and current prices is well established in work by Robert Shiller, John Cochrane, Vanguard, and many others. We have lived in a world where asset prices go up, when even major drops are made up relatively quickly by the high returns that follow. Probably, demographics and the push to save for retirement have contributed, but monetary and fiscal policy have almost certainly played a role as well. Thus, we keep putting off the time during when prices will stop increasing—a change that will lop off a major component of returns.
Unless interest rates continue to drop in the future, we will ultimately have to survive on bond yields and yield plus earnings growth for stocks, with no asset price increases to boost returns. Bond yields on a typical fixed-income portfolio in early 2019 are about 3 percent, while stock yields plus a reasonable estimate of earnings per share growth for the S&P 500 would be about 7 percent. That leaves us with an estimated return of a little above 5 percent for a 60/40 portfolio.
The potential for bond prices to drop if (when?) interest rates rise has been widely reported, but there is less awareness about the potential impact of higher rates on U.S. equity prices (low rates in other developed countries appear to be offset by negative sentiment, keeping prices lower). If we do adjust to a more “normal” world of higher interest rates at some point soon, lower prices on stocks and bonds will follow—immediately for bonds, and eventually for stocks. Portfolio returns would be reduced below the basic return from yields and earnings growth (estimated at a little above 5 percent above) during the period where prices adjust. The silver lining is that these lower returns enable higher returns in the following period.
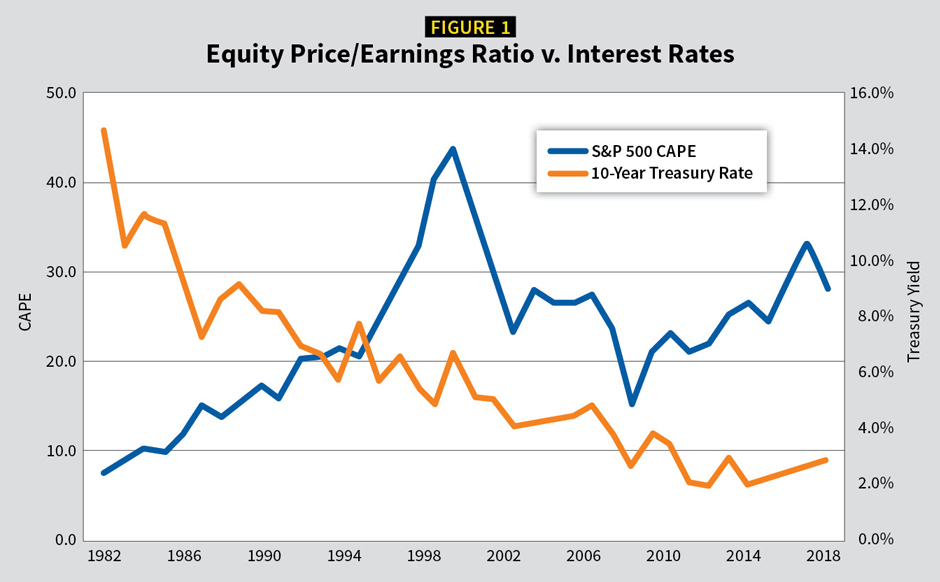
Figure 1 shows the relationship of equity prices to interest rates. Generally, as rates go down, equity prices go up. Of course, equity prices are also influenced by market sentiment. The chart shows the “irrational exuberance” of the late 1990s, where there is a spike in prices without a corresponding drop in interest rates. The price-to-earnings ratio used in Figure 1 is the cyclically adjusted price-to-earnings (CAPE) ratio introduced by Robert Shiller.[1]
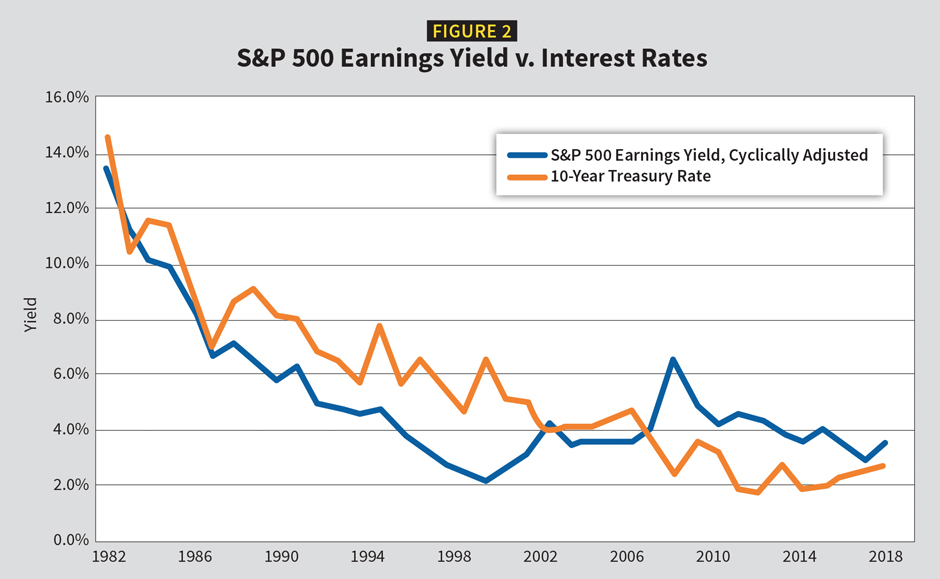
Figure 2 provides a clearer visual picture of the relationship between equity prices and interest rates, simply by showing the inverse of the price/earnings ratio—the earnings yield. Figure 2 uses the same data as Figure 1 but shows cyclically adjusted earnings yield equal to 1/CAPE. This chart is an example of the fundamental principle that all financial asset prices—equity and fixed income, but real estate and other assets as well—are simply the discounted value of future cash flows. When interest rates change, prices (which are the inverse of yields) eventually adjust and that becomes part of the return that we experience. Just like bonds, as equity yields drop, prices go up, increasing past returns.
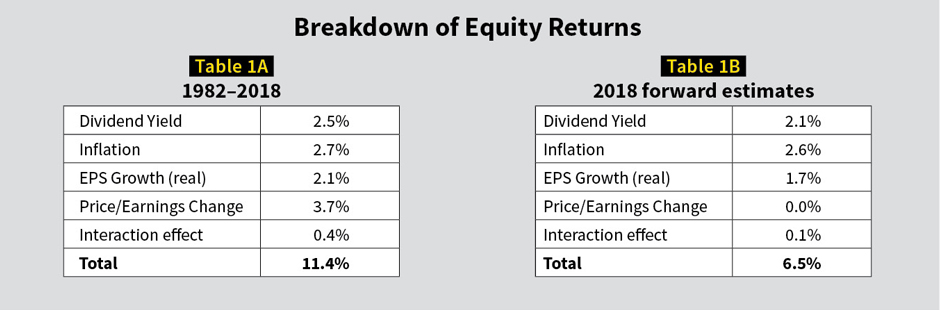
Based on changes in interest rates and the Shiller CAPE ratio, we can estimate that equity returns have been pushed up by almost 400 basis points per year since 1982 due to decreasing interest rates.[2] Thus, the roughly 11.4 percent annual equity returns that we’ve experienced in the U.S. during that period can be viewed as 7.7 percent returns with an extra 3.7 percent coming from lower rates and the corresponding higher prices. If interest rates increase, we are likely to see a reversal of some of this impact. Prices for virtually every asset class are high, indicating lower returns ahead.
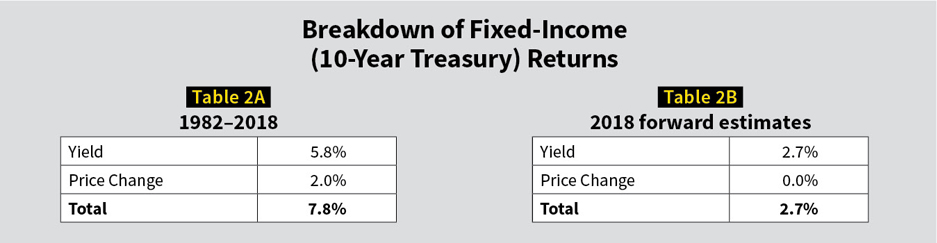
The tables below show how different future returns are likely to be, even with no future rise in interest rates that would push down prices.
Interest rates aren’t the only potential driver of low returns. Debt, demographics, and “De Fed” are looming too. Massive, and growing, levels of debt in the U.S. portend lower economic growth as the discretionary spending capacity of governments becomes constrained. At the same time, productivity is likely to decline as Baby Boomers retire and asset prices may decline as Boomer retirees become net spenders of their wealth rather than net savers. The correlation between asset returns and demographics has been documented by Rob Arnott and others.
In addition, the Fed plans to reduce its holdings of more than $4 trillion worth of Treasury and mortgage-backed securities in the next several years,[3] which will be a drag on markets. While interest rates may be only a medium-term issue if asset prices adjust down over the next 5–15 years, debt and demographics could drag down growth and returns for decades to come.
At some point, high levels of government debt may drive up Treasury yields as the demand for owning U.S. debt may not be able to keep up with the supply. It’s impossible to know for sure how much impact this factor will have. These higher yields would increase future returns but would also push down asset prices, decreasing returns as yields adjusted.
Ironically for pension plans and Baby Boomers reaching retirement in the near future, the best scenario may be for rates to stay low or go even lower. If rates were to go up significantly in the near future and asset prices drop correspondingly, more damage will be done than if prices continue to be propped up by lower rates for some years to come. As both pensions and retirees enter into their decumulation phase where cash outflows are larger than cash inflows, the earlier a big drop in asset values happens, the more significant the impact is.
Despite the challenge of adjusting perspective, this future world where returns are much lower than in recent decades needn’t be anticipated with doom and gloom. Wonderful things are likely to happen for society in the future, and the economy is likely to produce asset returns significantly higher than inflation. However, it is important to expect asset portfolios to grow more slowly and provide less income for spending than in the past.
We’ve already “used up” some of the returns that would have accrued in the future if prices hadn’t increased so much already. High expectations, along the lines of returns that we’ve experienced for the past 30–40 years, will create problems. The sooner we get our expectations at the right level, the better off we’ll be—and the more trouble we’ll avoid.
EVAN INGLIS, MAAA, FSA, FCA, EA CFA, is an independent consultant and an associate director at D3P Global Pension Consulting.
Endnotes
[1] CAPE ratios are determined by using 10-year averages of inflation adjusted earnings in the denominator of the ratio, in an effort to filter out some of the noise in the signal.
[2] The data and math for this calculation are as follows CAPE at 1/1/1982 = 7.39; CAPE at 12/31/2018 = 28.42; Annual return from CAPE expansion = 28.42/7.39 ^ (1/37 years) – 1 = 3.71%.
[3] See https://www.federalreserve.gov/econres/notes/feds-notes/projected-evolution-of-the-soma-portfolio-and-the-10-year-treasury-term-premium-effect-20170922.htm.
References
Greenwood, Robin and Andrei Shleifer. 2014. Expectations of Returns and Expected Returns. Oxford University Press.
Shiller, Robert J. 2015. Irrational Exuberance, Revised and Expanded Third Edition. Princeton University Press.
Davis, Joseph, Roger Aliaga-Diaz and Charles Thomas. 2012. Forecasting Stock Returns: What Signals Matter, and What Do They Say Now? Vanguard.
Cochrane, John. 2010. Presidential Address: Discount Rates. Journal of Finance.
Arnott, Robert and Anne Casscells. 2003. Demographics and Capital Market Returns. Financial Analysts Journal.
Price Waterhouse Coopers. 2016. The long view: how will the global economic order change by 2050.
Office of the Chief Actuary of the Social Security Administration. 2018. The Long-Range Economic Assumptions for the 2018 Trustees Report.